The Google Ads platform is very competitive, especially for certain keywords. Some competitors are doing better than others and shroud their activities in mystery. What are they excelling in that others are not able to replicate? Instead of guessing, use the Google Ads Auction Insight Report to understand those competitors and gain insights for a successful Google Ads campaign.
The experts at Google Ads have blessed everyone with freshly compiled data on competitive paid search auctions, all compacted into one neat little report. This report can help you get better insights into your own paid search campaigns by retrieving and analyzing select data from competitors within your niche. This guide will help you understand the Google Ads Auction Insight Report and guide you toward using it to its full potential. Read on to start outpacing your rivals now!

What Is the Google Ads Auction Insight Report?
Auction insights is the official name for this report, and it provides information on advertisers bidding on your chosen keywords. It is automatically generated within the Google Ads platform and is available 24/7, so long as you are logged in. It is a key tool for advanced digital marketers to analyze the competition and proceed to overcome them using data analysis and smart planning.
Please note that the Google Ads Auction Insight Report is only available after reaching a threshold of activity within your advertising campaign. Although there is no official number, rumor has it that the unofficial threshold is 1,000 visitors within the past 30 days. Additionally, there is a lag time of 24 hours, which may impact your analyses and should be taken into consideration for a full perspective.
You may further filter the results to retrieve the keywords, ad groups, and campaigns of your choice.
Where Can I Find the Google Ads Auction Insight Report?
You can find the Google Ads Auction Insight Report within your Google Ads account. Here are instructions to access it:
- Log into your Google Ads account
- Click any of the following: ‘Campaigns,’ ‘Ad groups’, or ‘Search keywords’
- Check the boxes on each item that you want to assess: campaign, ad group, keyword, or all
- Click ‘Auction insights’
You should now be inside the auction insights report. In addition to viewing the data within the dashboard, you can also choose to download it. Either way, you have a plethora of useful data at your disposal.
What Campaigns Can Use the Google Ads Auction Insight Report?
The Google Ads Auction Insight Report is available for Search, Shopping, and Performance Max campaigns. Each campaign can view certain types of data:
- Search Campaigns: able to generate reports for keywords, ad groups, and campaigns
- Shopping Campaigns: able to generate reports for ad groups and campaigns
- Performance Max Campaigns: able to generate reports for campaigns
When viewing the data for each campaign type, expect to find the items presented above.
What’s Included in the Google Ads Auction Insight Report?
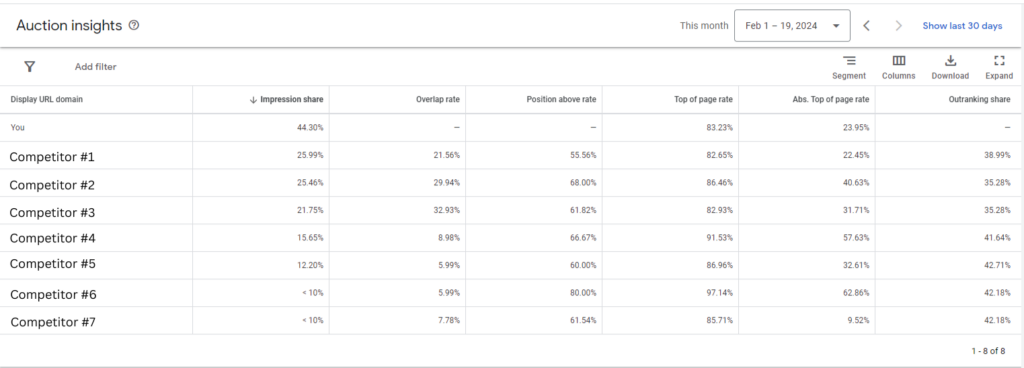
The Google Ads Auction Insight Report contains six metrics that can help digital marketers do well or better with their paid search campaigns. The metrics are as follows:
- Impression Share
- Overlap Rate
- Position Above Rate (Search Campaigns Only)
- Top of Page Rate (Search Campaigns Only)
- Absolute Top of Page Rate (Search Campaigns Only)
- Outranking Share
Each metric is displayed in percentage format. You can use the given number to determine how well your campaign performs compared to competing bidders. The higher the number, the more often you win. The lower the number, the less often your bids have won in that arena.
Let’s take a closer look at each metric:
Impression Share
How often did your ad receive an impression? The Impression Share metric delivers that information numerically, followed by a percentage symbol. This number expresses the percentage of times your ad received an impression compared to the total number of impressions available. The calculation is as follows:
Impressions received / Total eligible impressions = Impression share
This data is compiled from the auctions your ad competed in and not from the total number of auctions on the platform. The factors affecting this metric include Quality Scores, targeting settings, total budget, and bid amounts.
A high Impression Share means that your ad has high visibility in the marketplace, which means many people can view your advertisement. In other words, you are getting more opportunities to grow your brand awareness.
A low Impression Share could mean that your competitors are getting their brands out in front of the audiences, beating you out in the bidding wars, or that your budget cannot compete.
You can attempt to raise your Impression Share by adjusting your targeting, boosting your Quality Score, optimizing your bids, and working on your ad spend budget.
Overlap Rate
The Overlap Rate reveals how often a competitor received an impression when you received an impression, too. This could mean that they are bidding on the same keywords as you are, which also means that you can overtake them at any point. This is a vital metric for acquiring your most desired keywords.
For example, if your overlap rate is 50%, then in 50 out of 100 auctions, your ad is being served the same amount of times as a competitor.
Essentially, the Overlap Rate is a competitive analysis tool that you can use to track how well your competitors are doing.
- A high Overlap Rate means that your competitors have very similar campaign strategies. It could also mean that your direct competitors are competing for the same keywords as you.
- A low Overlap Rate could mean many things, such as low Quality Scores, low budget, low CPCs, and more.
You can try to do better with your campaigns using this information by understanding how much competition you really have. You could adjust your bidding strategy, narrow your targeting, raise your Quality Score, or abandon the most competitive keywords to boost the other metrics.
Position Above Rate (Search Campaigns Only)
The Position Above Rate metric focuses on the competitor rather than your own campaign. It exhibits the percentage of times competitor ads were in higher positions than your ads for a particular auction.
- When the number is higher, the competitor receives more impressions than you.
- When the number is lower, the competitor receives fewer impressions than you.
You can use this number to determine your level of competitiveness in the respective auctions. Competitors receiving more placement than you could mean that you will need to do some work with your strategy and make changes to improve your chances of ranking higher. Try adjusting your bids, increasing your Quality Score, tweaking your targeting, and altering your budget to gain greater traction in this metric.
Top of Page Rate (Search Campaigns Only)
The Google Search Engine Results Pages (SERPs) have an area at the top of the search results dedicated to serving sponsored advertisements. This is the area defined by this metric and tells you how often your ad was shown to users.
Getting your ad to the top of the SERP means getting as many eyeballs on your ad as possible. This metric is a good indicator of how well your bidding strategy is coming along.
- When the Top of Page Rate is high, your advertisement is getting a lot of exposure compared to your competitors.
- When the Top of Page Rate is low, it means that your competitors are winning the auctions to claim the top spot.
You can try to elevate your Top of Page Rate by tweaking your bids, reallocating your budget, elevating your Quality Score, and honing in on your target audience.
Absolute Top of Page Rate (Search Campaigns Only)
The Absolute Top of Page Rate pertains to the very first ad slot above the SERPs. This percentage correlates with the number of times your advertisement was placed in the first ad slot compared to the total number of slots available.
This data can help you figure out which campaigns are winning the auctions and then proceed to produce more creative assets that can be further tested for optimization. This metric will tell you whether the placement matters or not.
Outranking Share
Outranking Share reveals how often your ad was placed instead of competitor advertisements. This number indicates the number of times your ad has won the auction and can be used to find your best bidding strategies.
You can use this data to determine which campaigns are doing best, then reverse engineer them to determine why they performed so well. Once you discover what led you to the winning lane, you can infuse that knowledge into your other campaigns to continue the success story.
How Do I Use the Google Ads Auction Insight Report?
The Google Ads Auction Insight Report is a powerful tool for digital marketers to gauge performance by comparing stats with competitors. This data can help you identify your winning campaigns and fix the under-performing ones. There is a lot of data to sift through, so you can use it to do any of the following and more:
- Analyze data to find your weak spots
- Zoom in on your winning auctions
- Determine the best times for competitors to advertise
- Identify the types of devices competitors are targeting
- Find out where your competitors are winning
- Estimate how much competitors are spending
Through a combination of data analysis, personal insights, and active engagement, you can achieve many goals with the help of the Insight Report.
Segment Devices and Timing
One great way to dig deeper into your analyses is to view your audience based on the time of the ad impression, the type of device used, or both. This technique is called segmentation and can be used to your advantage for keywords, campaigns, or ad groups.
A Note About Seasonal Trends
Black Friday, winter holidays, and Valentine’s Day are all good examples of seasonal trends that may affect your Google Ads. Thanks to Auction Insights, you can analyze the data from those periods and tweak your campaigns in preparation for the next rush.
When you know that a prominent shopping season is around the corner, you could start changing the times on your campaigns to become active during the most opportune periods to gain more exposure. Since there will be higher amounts of traffic, you can increase your budget to serve more ads to the influx of search users.
After the holiday, you can revert to your normal routine and return everything to the original settings.
Contact J&L Marketing for Guidance
At J&L Marketing, we know the competition in paid search advertising is rough, and we’re here to help you overcome your competition. We create custom digital marketing campaigns tailored to your specific business, industry, and long-term goals. If you need someone to guide you through the paid search maze, contact us today for a free consultation so we can get you started on a fresh new campaign.